14 Timber Harvest Rate Evaluation
As described in Chapter 2, Chapter 11, and Chapter 12, the Kuamut project baseline was developed ex-ante, following the guidelines in the VM0010 methodology, and was based on the management plans of comparable concessions within Sabah (i.e. common practices). The volumes of timber available for harvest (above the specified cutting limits) were estimated using wall-to-wall, machine-learning-derived maps for the project area (Chapter 7). Importantly, reported harvest data from other concessions were not used to constrain the timber harvest volumes or densities in the Kuamut baseline.
This approach provides a unique opportunity to independently evaluate the timber harvest rates proposed in the Kuamut baseline by comparing them with reported harvest rates from similar concessions across Sabah.
The Sabah Forestry Department has provided annual records of timber harvest volumes and areas for all managed forest concessions in Sabah from 2010 to 2021. These data were also used to assess leakage in Chapter 19.
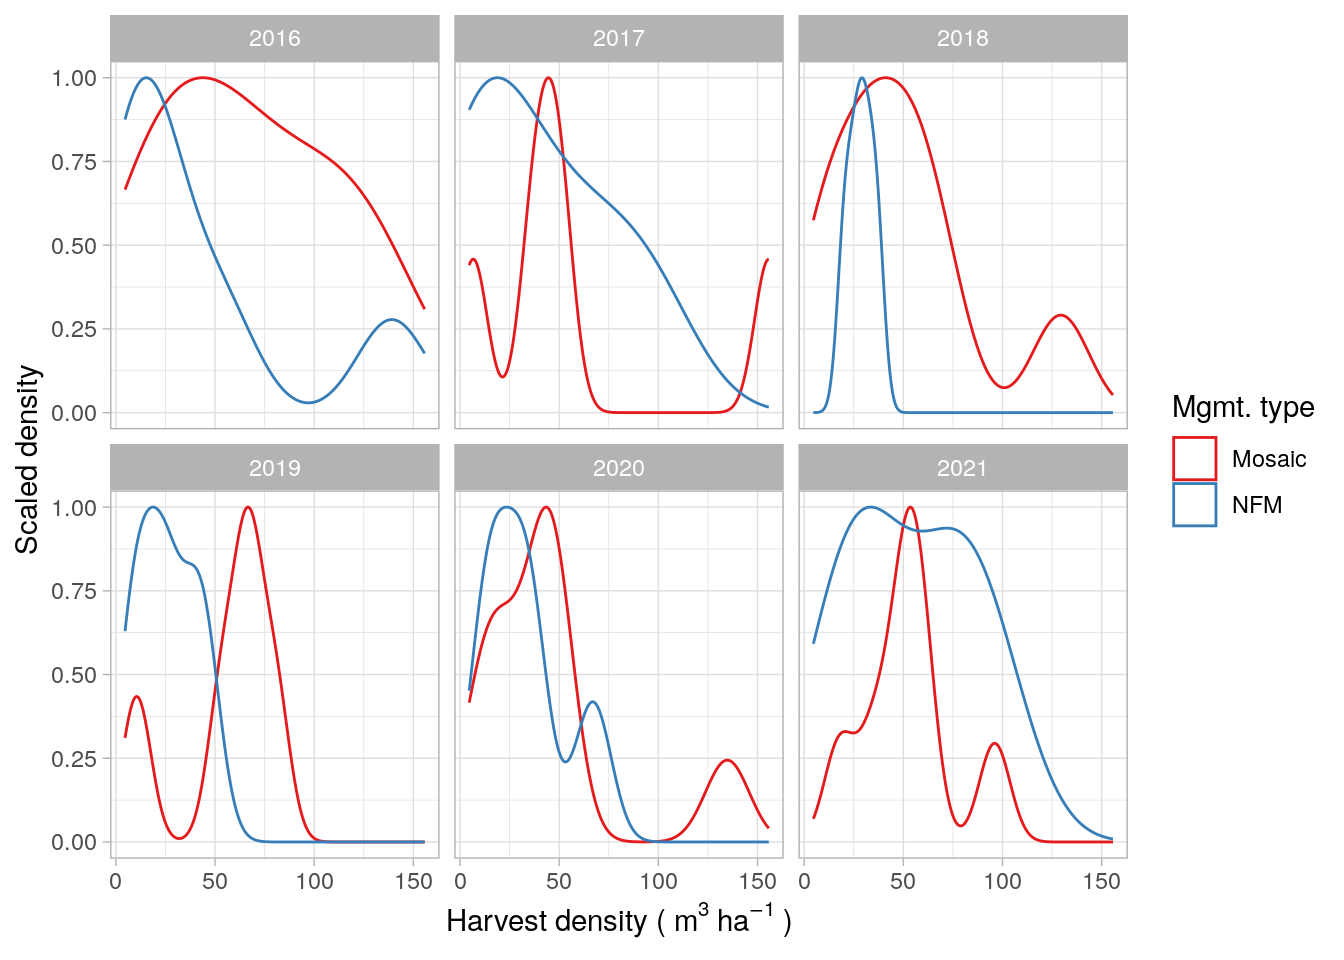
Here, we use these data to examine the distribution of harvest densities reported across Sabah between 2016 and 2021 for both Mosaic and Natural Forest Management concessions (Figure 14.1).
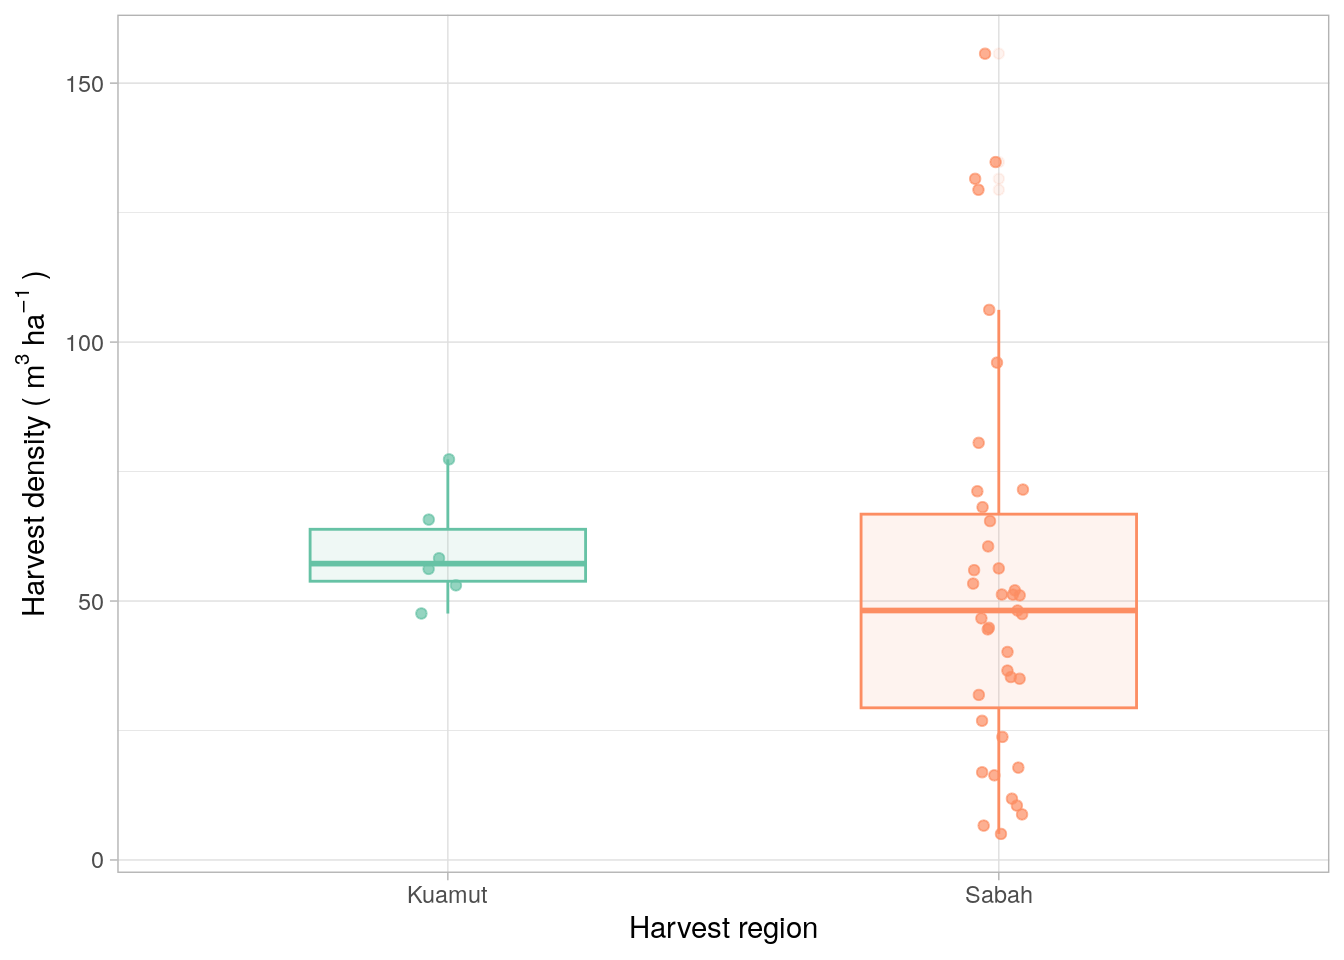
We then directly compared the range of reported timber harvest densities for the years 2016–2021 in the Kuamut Project with the state-wide dataset (Figure 14.2). During this period, the Kuamut baseline only projected timber harvest from the Mosaic strata; therefore, only data from other Mosaic concessions in Sabah are used for comparison.
The mean projected timber harvest density, that was used for the baseline, for the Kuamut project between 2016 and 2021 is shown in green in Figure 14.2. The mean reported harvest density across all Mosaic concessions in Sabah, during the same period, is shown in orange for comparison. There is clear overlap between the interquartile ranges of the Kuamut project and Sabah Mosaic concessions, indicating that our method of estimating harvest using state laws and common practice, combined with our timber density maps, produce accurate harvest intensities comparable to those observed across the rest of the state, during the monitoring period.
The mean projected timber harvest density, that was used for the baseline, was 59.7 m3 ha-1. For comparison, the mean reported harvest density across all Mosaic concessions in Sabah after the end of the same period was 54.7 m3 ha-1. The Kuamut project’s mean harvest density was therefore 9.1% higher than the Sabah average. However, as can be seen from the graph, the spread of data is substantial and our predictions fall within the interquartile ranges of the ex-post measured data.
It should also be noted that the Kuamut baseline does not explicitly account for timber used in infrastructure development (in for example Eq. 4 of the VM0010 methods), as data on these volumes are unavailable. As a result, timber used for infrastructure is assumed to be included within the overall estimate of extracted timber volume. Since timber harvested for infrastructure is not explicitly reported (because it is used before official timber volume recording), it is also absent from the reported Sabah dataset. Therefore, the slightly higher harvest densities observed in Kuamut are expected and appropriate.
14.1 Summary
The projected timber harvest density for the Kuamut project baseline between 2016 and 2021 showed very strong agreement with reported harvest densities from all Mosaic concessions in Sabah during the same period (Figure 14.2).
The Kuamut project’s mean harvest density was 9.1% higher than the Sabah average. However, given Kuamut’s significant timber resources, as shown in the measured timber volume maps (Figure 11.1 and Figure 11.2), and the implicit inclusion of timber used for infrastructure in the overall harvest estimate, this difference is expected and appropriate.
The Kuamut project’s timber harvest estimates are based on comprehensive field data and advanced machine-learning models that accurately map timber volumes across the project area. The close alignment between Kuamut’s baseline harvest densities and those observed across Sabah demonstrates the reliability and robustness of the project’s timber harvest projections.
14.2 Code
Mosaic Timber Harvest Plan Code R/evaluate_harvest_rate.R
#' preprocess Sabah-level timber harvest data
#' @param sabah_thp path to the Sabah timber harvest plan data.
#' @return list of dataframes: sabah timber harvest data and annual summary.
prep_sabah_thp_df <- function(sabah_thp) {
  # create combined timber production file for Sabah.
  stp <- sabah_thp |>
    vroom::vroom() |>
    dplyr::filter(YEAR >= 2016, HarvestVolume > 0) |>
    dplyr::mutate(
      region = "Sabah",
      LandUse = dplyr::case_when(
        LandUse == "SalvageLogging" ~ "Mosaic",
        TRUE ~ LandUse
      ),
      LandUse = factor(
        LandUse,
        levels = c("Mosaic", "NFM")
      )
    ) |>
    dplyr::rename(year = YEAR, landuse = LandUse)

  # summarize by land use and year
  stp_ansum <- stp |>
    dplyr::group_by(landuse, year) |>
    dplyr::summarise(
      region = "Sabah",
      mean_vol_ha = mean(Vol_ha, na.rm = TRUE)
    ) |>
    dplyr::select(year, landuse, region, mean_vol_ha)
  return(list(stp = stp, stp_ansum = stp_ansum))
}

#' preprocess Kuamut baseline timber harvest plan data
#' @param kthp_file path to the Kuamut timber harvest plan data.
#' @return dataframe of annual summary of Kuamut timber harvest data.
prep_kuamut_thp_df <- function(kthp_file) {
  # read in the timber harvest plan data for kuamut
  kuam_mos_thp <- kthp_file |>
    read.table()

  mthp_formatted_df <- kuam_mos_thp |>
    dplyr::filter(LogYear >= 2016 & LogYear <= 2021)

  ktp_ansum <- mthp_formatted_df |>
    dplyr::group_by(LogYear) |>
    dplyr::summarise(
      landuse = "Mosaic",
      region = "Kuamut",
      mean_vol_ha = weighted.mean(V_EX, w = Area_ha)
    ) |>
    dplyr::select(year = LogYear, landuse, region, mean_vol_ha)

  return(ktp_ansum)
}

#' combine Sabah and Kuamut timber harvest plan data
#' @param sabah_th dataframe of Sabah timber harvest data.
#' @param kuamut_th dataframe of Kuamut timber harvest data.
#' @return combined dataframe of Sabah and Kuamut timber harvest data.
combine_sabah_kuamut_mos_thp <- function(sabah_th, kuamut_th) {
  sabah_th |>
    dplyr::filter(landuse == "Mosaic") |>
    dplyr::bind_rows(kuamut_th)
}

#' summarize Sabah and Kuamut timber harvest data
#' @param k_s_df combined dataframe of Sabah and Kuamut timber harvest data.
#' @return dataframe of summary statistics of Sabah and Kuamut timber harvest data.
sabah_kaum_sum_stat <- function(k_s_df) {
  k_s_df |>
    dplyr::group_by(region) |>
    dplyr::summarise(
      mr_mean_vol_ha = mean(mean_vol_ha, na.rm = TRUE),
      mr_med_vol_ha = median(mean_vol_ha, na.rm = TRUE)
    ) |>
    as.data.frame()
}

#' plot annual density distributions of timber harvest data in Sabah
#' @param sabah_thdf dataframe of Sabah timber harvest data.
#' @param sabah_thstat dataframe of annual summary of Sabah timber harvest data.
#' @return ggplot object of annual density distributions of timber harvest data in Sabah.
annual_panel_sabah_density_plot <- function(sabah_thdf, sabah_thstat) {
  sabah_thdf |>
    ggplot() +
    aes(x = Vol_ha, y = after_stat(scaled), colour = landuse) +
    geom_density(alpha = 0.4) +
    theme_light() +
    scale_colour_brewer(palette = "Set1") +
    labs(
      y = "Scaled density",
      x = bquote("Harvest density (" ~ m^3 ~ ha^-1 ~ ")")
    ) +
    labs(colour = "Mgmt. type") +
    facet_wrap(~year)
}

#' plot boxplots comparing Kuamut and Sabah timber harvest data
#' @param stp dataframe of Sabah timber harvest data.
#' @param ktp dataframe of Kuamut timber harvest data.
#' @return ggplot object of boxplots comparing Kuamut and Sabah timber harvest data.
kuam_sabah_boxplot_compare <- function(stp, ktp) {
  stp |>
    dplyr::filter(landuse == "Mosaic") |>
    dplyr::select(year, landuse, region, mean_vol_ha = Vol_ha) |>
    dplyr::bind_rows(ktp) |>

    ggplot() +
    aes(x = region, y = mean_vol_ha, color = region, fill = region) +
    geom_boxplot(width = 0.5, alpha = 0.1) +
    geom_jitter(width = 0.05, alpha = 0.7) +
    theme_light() +
    scale_colour_brewer(palette = "Set2") +
    scale_fill_brewer(palette = "Set2") +
    labs(
      x = "Harvest region",
      y = bquote("Harvest density (" ~ m^3 ~ ha^-1 ~ ")")
    ) +
    theme(legend.position = "none")
}

#' Evaluate timber harvest rates in Sabah and Kuamut
#' @description a wrapper function to coordinate the multiple functions required
#' to evaluate timber harvest rates in Sabah and Kuamut.
#' @param sabah_thp path to the Sabah timber harvest plan data.
#' @param kuam_mos_thp path to the Kuamut timber harvest plan data.
#' @return list of summary statistics and plots comparing timber harvest rates in Sabah and Kuamut
evaluate_timber_harvest_rate <- function(sabah_thp, kuam_mos_thp) {
  sabah_th <- prep_sabah_thp_df(sabah_thp)

  kuamut_th <- prep_kuamut_thp_df(
    kuam_mos_thp
  )

  k_s_mos_thp <- combine_sabah_kuamut_mos_thp(sabah_th$stp_ansum, kuamut_th)

  k_s_stat <- sabah_kaum_sum_stat(k_s_mos_thp)

  sab_dens_plot <- annual_panel_sabah_density_plot(
    sabah_th$stp,
    sabah_th$stp_ansum
  )

  kuam_box_plot <- kuam_sabah_boxplot_compare(sabah_th$stp, kuamut_th)

  return(list(
    kstat = k_s_stat,
    sabah_dens_plot = sab_dens_plot,
    kuam_box_plot = kuam_box_plot
  ))
}